
Global Market Structure organizes liquidity, macro regimes, market cycles, intermarket relationships, capital flows, market breadth, and risk environments into a structured framework for understanding broad market conditions.
Markets often reflect more than one force at the same time. Liquidity can change the availability of risk capital, cycles can shape the phase of the environment, intermarket relationships can confirm or challenge one asset-class signal, and breadth can show whether participation is broad or concentrated.
The useful role of global market structure is classification. It separates the main forces behind market conditions so that risk appetite, policy pressure, cross-asset behavior, and capital movement can be interpreted together rather than treated as disconnected signals.
These relationships organize market context; they do not create automatic forecasts, trade alerts, stock picks, or buy/sell signals.
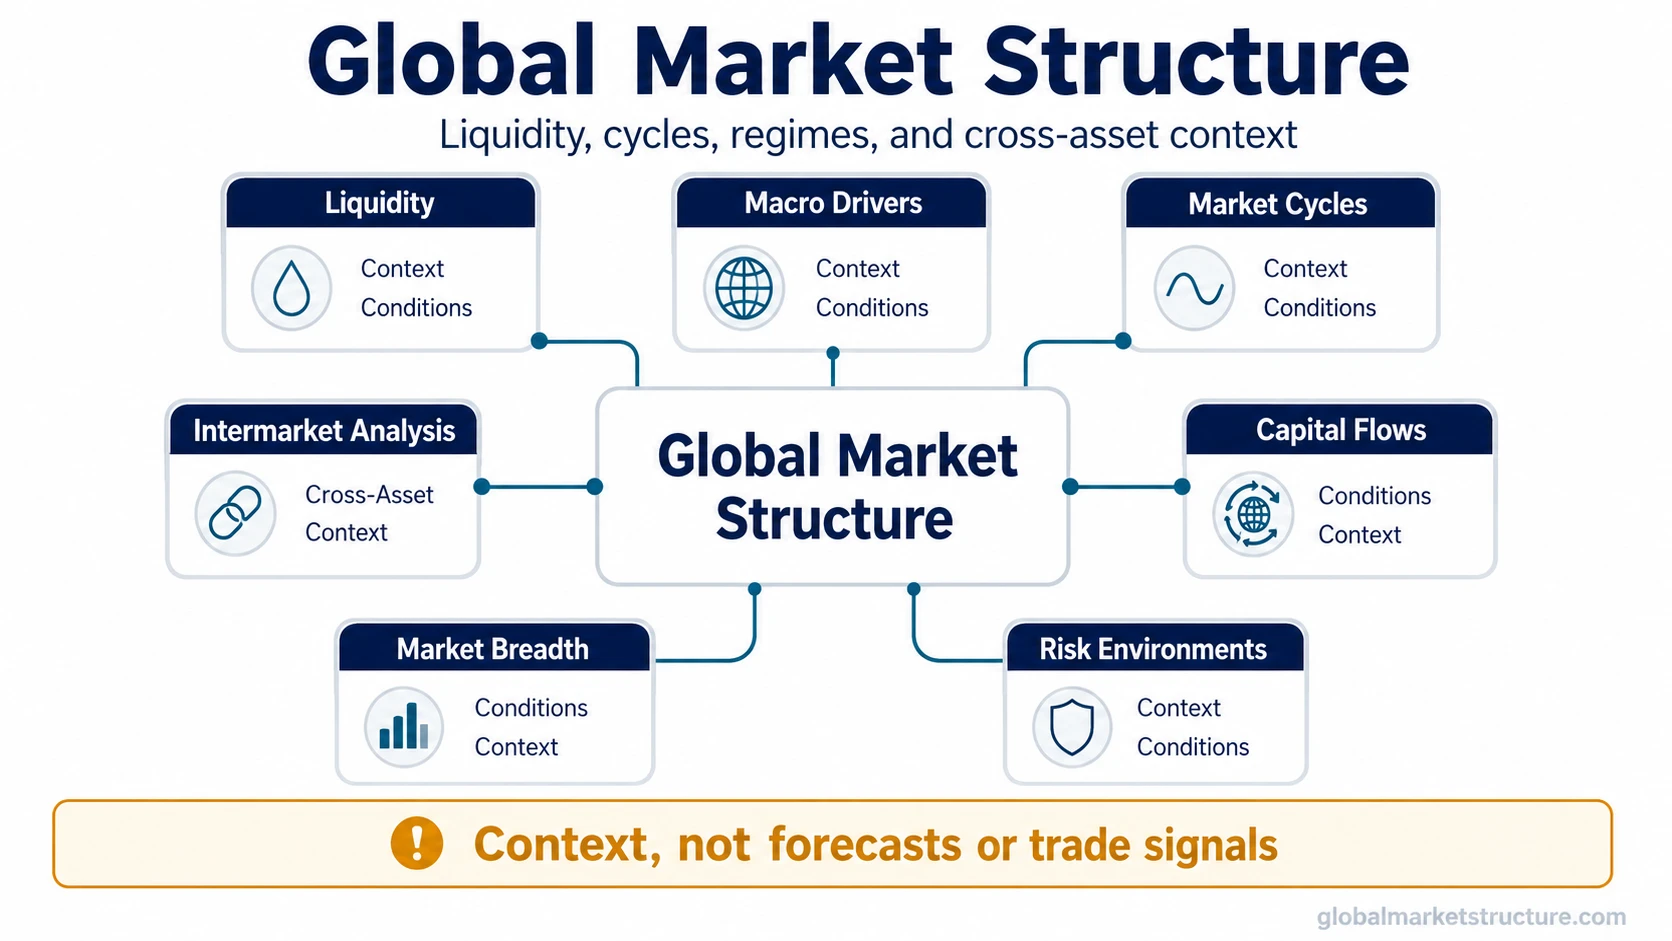
Market Conditions Map
Global market structure becomes clearer when each area has a specific job. Liquidity, cycles, macro drivers, intermarket behavior, capital flows, breadth, and regimes each answer a different part of the same question: what kind of environment are markets operating in?
| Area | Main Market Question | Concept Path | Boundary |
|---|---|---|---|
| Liquidity and Monetary Conditions | Are financing pressure, policy transmission, cash availability, and market depth changing? | Liquidity, financial conditions, central-bank liquidity, repo markets, funding stress. | Official data sources remain the right place for raw current data. |
| Market Cycles | Which phase of broad market behavior is most relevant? | Market cycle, business cycle, credit cycle, bull markets, bear markets. | Cycle labels describe context, not fixed timing. |
| Macro Drivers | Which growth, inflation, policy, rate, or labor-force pressure is driving repricing? | Inflation, growth data, interest-rate expectations, central-bank policy, real yields. | Macro data needs sequence and context before it becomes useful for market interpretation. |
| Intermarket Analysis | Do equities, bonds, currencies, commodities, credit, and rates agree? | Intermarket analysis, cross-asset relationships, dollar pressure, yields, commodities. | Cross-asset confirmation can strengthen or weaken a view, but correlation is not causation. |
| Capital Flows and Positioning | Where is exposure moving across countries, currencies, sectors, and asset classes? | Capital flows, positioning, foreign exchange pressure, reserve flows, risk allocation. | Flows can reflect policy, hedging, balance-sheet needs, or portfolio rotation. |
| Risk Environments and Market Regimes | Are markets rewarding risk exposure, demanding safety, or moving into stress? | Risk-on risk-off, market regimes, volatility, stress, breadth, defensive leadership. | Regime labels organize evidence. They do not forecast the next market move by themselves. |
How the Main Areas Connect
Macro drivers create the first layer of pressure. Growth, inflation, labor data, central-bank policy, and interest-rate expectations influence discount rates, credit conditions, currency pressure, and risk appetite.
Liquidity adds the financing layer. A market can look stable while funding conditions, collateral demand, or market depth are weakening underneath. That difference matters because price moves often become more fragile when liquidity is thinner.
A market cycle adds phase context. The same economic number can mean something different during early recovery, late expansion, policy tightening, or stress. Cycle position changes how markets process the same information.
Intermarket analysis checks whether the message is isolated or broad. Equity strength looks different if credit spreads are calm, yields are stable, the dollar is contained, and commodities confirm the same growth view. It looks weaker when those markets disagree.
Capital flows and positioning show where exposure is moving. Flows can reinforce a trend, expose crowded positioning, or reveal stress when money leaves risk assets and moves toward liquidity, safety, or reserve assets.
Risk, Breadth, and Regime Context
Risk-on risk-off describes whether markets are rewarding risk exposure or demanding safety, liquidity, and balance-sheet protection. It is a regime lens, not a trading instruction.
Market breadth adds participation context. A broad advance across sectors and asset classes usually carries a different message from a narrow market led by a small group of large names. Narrow leadership does not automatically mean weakness, but it can change the quality of the move.
Regime interpretation improves when these signals are compared together. Liquidity, credit, yields, the dollar, breadth, volatility, and sector leadership can either point in the same direction or create a mixed environment where conviction should stay lower.
Example: Financial conditions begin tightening while equity indexes remain close to their highs. At the same time, market breadth narrows and defensive sectors start holding up better than cyclical sectors. That combination does not prove a downturn, but it changes the quality of the environment because liquidity, participation, and leadership are no longer giving the same message as headline index levels. The reading stays weaker if credit, yields, and sector leadership do not confirm the same defensive shift.
What These Frameworks Cannot Do
Global market structure does not turn one indicator into a forecast. A liquidity measure, a yield move, a dollar breakout, a breadth reading, or a risk-on risk-off label can all be useful, but none of them defines the full environment alone.
Limitation: Market structure frameworks organize evidence. They do not create automatic buy signals, sell signals, price targets, or timing calls. Current data claims about liquidity, financial conditions, credit, policy, or market stress require dated source verification before they can be treated as factual.
The stronger reading usually comes from alignment. Liquidity, credit, yields, currency pressure, breadth, volatility, and leadership become more informative when they move together. When they conflict, the environment is usually less stable than a single headline number suggests.
Where to Start
Start with the pressure that needs explanation. Liquidity and monetary conditions clarify funding and policy transmission. Market cycles clarify phase. Macro drivers identify growth, inflation, policy, and rate pressure. Intermarket analysis compares asset-class behavior. Capital flows and positioning show where exposure is moving. Risk environments and market regimes classify the broader tone.
| Starting Question | Best Starting Area |
|---|---|
| Are financing conditions becoming easier or tighter? | Liquidity and Monetary Conditions |
| Which phase of the broader cycle is most relevant? | Market Cycles |
| Which economic forces are driving repricing? | Macro Drivers |
| Do bonds, currencies, commodities, credit, and equities agree? | Intermarket Analysis |
| Where is capital moving and how crowded is exposure? | Capital Flows and Positioning |
| Are markets rewarding risk or demanding protection? | Risk Environments and Market Regimes |